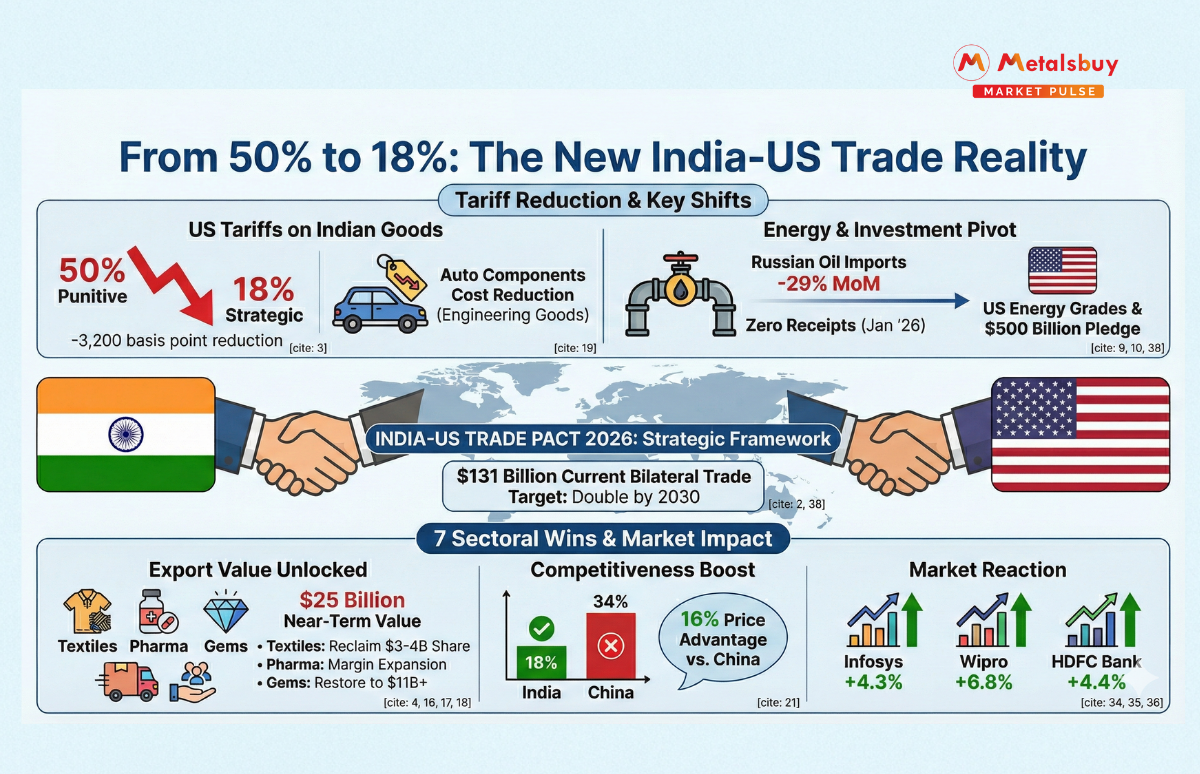
In a decisive move recalibrating the $131 billion corridor between the world’s largest democracy and its largest economy, the US and India have unveiled a landmark 2026 trade framework. Announced by President Donald Trump and Prime Minister Narendra Modi, the deal slashes effective US tariffs on Indian goods from a punitive 50 percent to 18 percent—a massive 3,200 basis point reduction. This shift, contingent on energy and investment pivots, is projected to unlock over $25 billion in near-term export value across seven key industries.
The Core Deal: Trade Relief for Strategic Realignment
The agreement’s USP lies in its financial precision. For six months, Indian exporters faced a 50 percent composite duty structure linked to sanctioned Russian crude. The 2026 pact dismantles this, delivering an immediate 64 percent cost reduction.
In exchange, New Delhi is executing a verifiable energy transition. Trade data for January 2026 shows a 29 percent month-on-month decline in Russian oil imports. Reliance Industries, India’s largest private refiner, reported zero receipts of Russian crude for January, pivoting to US WTI grades. This "Trade for Energy Security" model has effectively reset the bilateral relationship.
7 Big Wins: The Sectoral Beneficiaries
The tariff reduction is a targeted stimulus for India’s most capital-intensive sectors. Below is the breakdown of the "Big 7" winners, supported by FY25 baseline performance data:
- Textiles and Apparel: The biggest winner. In 2025, exports lagged at $6.2 billion vs. Vietnam’s $10.4 billion. The new 18% rate levels the field against Vietnam’s 20%, positioning India to recapture $3–4 billion in market share.
- Pharmaceuticals: With FY25 exports at $9.78 billion, the cut expands operating margins by 400-500 basis points, securing supply chains for the US healthcare system.
- Gems and Jewellery: After late 2025 contractions, the rollback is expected to restore annualized volumes to pre-tariff levels of $11 billion+, vital for Surat’s diamond hubs.
- Engineering Goods: Following 5.35% growth in early FY25, the sector revives competitiveness for auto components, targeting double-digit growth.
- IT Services & Technology Hardware: While services remain resilient, electronic goods (up 26% in Aug '25) get a direct boost, aiding hardware exports.
- Specialty Chemicals: The tariff differential (India 18% vs. China 34%) gives Indian exporters a distinct 16 percentage point price advantage.
- Agriculture and Marine Products: Safeguards the 17.4% growth trajectory in marine exports, particularly for shrimp and seafood valued at over $2 billion annually.
Regional Competitiveness: How India Stacks Up
The 18 percent rate brings India to near parity with competitors. While lacking GSP benefits, the reduction closes the gap with Vietnam and Bangladesh and significantly outperforms China.
Comparative Tariff Landscape (2026 Estimates):
|
Country |
Effective US Tariff Rate |
GSP Benefit Status |
Competitive Position |
|
India |
18% |
No (Withdrawn 2019) |
High Competitiveness |
|
Vietnam |
20% |
Yes (~5% advantage) |
Moderate Parity |
|
Bangladesh |
20% |
Yes (~5% advantage) |
Moderate Parity |
|
Pakistan |
19% |
Yes (~5% advantage) |
Close Competitor |
|
China |
34% (Delayed to Nov '26) |
No |
Low (Disadvantaged) |
Analysis: Previously, at 50%, India was priced out of the market. Now at 18%, India is technically cheaper than Vietnam (20%) and Bangladesh (20%) on headline rates. However, when accounting for the ~5% GSP advantage those nations retain, India is now operating at a level playing field rather than a massive deficit. Crucially, against China’s 34% rate, India now holds a distinct 16 percentage point pricing power, accelerating the "China Plus One" shift for global supply chains.
Market Reaction and Economic Impact
Financial markets priced in the "deal dividend" immediately. On the announcement day, indices saw sharp sector-specific rallies:
- Infosys: +4.3% (adding ~$3B in market cap)
- Wipro: +6.8%
- HDFC Bank: +4.4%
The deal bolsters the Trade Surplus, which stood at $40.82 billion in FY25. President Trump’s $500 billion investment pledge targets long-term infrastructure, potentially doubling bilateral trade by 2030.
Data Focus: The Pivot in Numbers
The following table summarizes the key financial shifts and year-on-year comparisons driving the 2026 outlook.
|
Key Metric |
Previous / Baseline (2025) |
New / Projected (Feb 2026) |
Change / Impact |
|
Effective US Tariff |
50.0% |
18.0% |
-3,200 bps (-64%) |
|
Russian Oil Imports |
High Volume |
-29% MoM |
Sharp Decline |
|
Reliance Ind. Oil Receipt |
Standard Flows |
Zero (Jan '26) |
100% Cessation |
|
India-US Bilateral Trade |
$131 Billion (Est.) |
Target: $150B+ |
Growth Trajectory |
|
Textile Export Gap |
Trailing Vietnam by ~$4B |
Gap Narrowing |
Competitiveness Restored |
|
Pharma Exports (US) |
~$9.8 Billion |
$11.5 Billion (Proj) |
Margin Expansion |
|
Infosys Stock |
-- |
+4.3% |
Immediate Rally |
|
Invt. Commitment |
-- |
$500 Billion |
Long-term Pledge |
Outlook
The deal replaces a punitive "stick" with a pragmatic "carrot." While the 18 percent rate is higher than the zero-tariff goal of a full Free Trade Agreement (FTA), it effectively neutralizes the advantage held by competitors like Vietnam. The focus now shifts to execution: specifically, whether Indian refiners can permanently substitute the 1.5 million+ barrels per day of Russian crude historically imported, and if the US manufacturing supply chain will accelerate its shift to India to meet the $500 billion investment target.